The aim of this report is to compare QGIS Server performances according to several versions (2.14, 2.18, 3.0, 3.2 and master branch). Moreover, some configurations are tested too like parallel rendering, trust option, PAL candidates, ... This way, we're able to keep an eye on regressions and improvements!
For now, only GetCapabilities and GetMap requests are tested. Regarding the underlying data, a Postgis database is used (with several kinds of geometries, as described in each tests) as well as GeoTIFF images.
The aim of this test is to measure the response time of the server for the GetCapabilities request with the default configuration.
Dataset:
1 Point layer named adress_ban (~ 450 000 features) with the Single symbol renderer and without labels
1 Line layer named hydro_segment (~ 14 000 features) with the Categorized renderer and without labels
1 Polygon layer named vw_clc2006 (~ 3 000 features) with the Categorized renderer and without labels
1 Polygon layer named hydro_lake (~ 800 features) with the Single symbol renderer and without labels
1 Polygon layer named landuse_corine_lc_2006 (~ 3 000 features) with the Categorized renderer and without labels
1 Raster layer named eu_dem_v11 (5324 x 3374)
Results
GetCapabilities: Postgres view and trust option
Description
The aim of this test is to measure the response time of the server for the GetCapabilities request with Postgres view and the trust option.
When the trust option is activated, the response time of the very first request should be much more lower.
Dataset:
1 Point layer named adress_ban_view based on a Postgres view (~ 14 000 features) with the Categorized renderer and without labels
Results
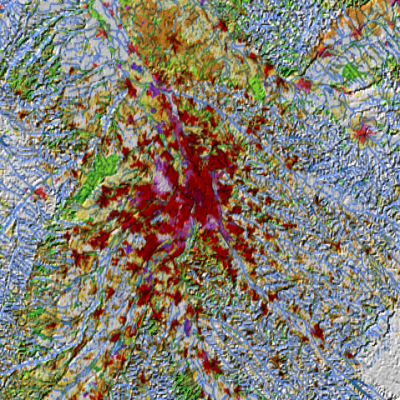
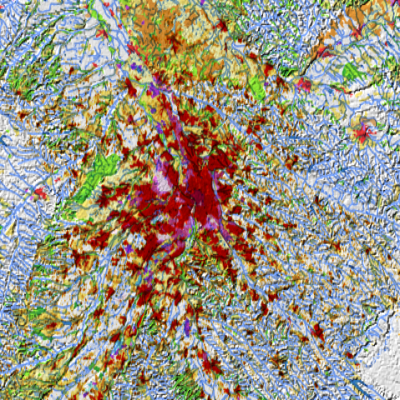
GetMap: Parallel Rendering
Description
The aim of this test is to measure the response time of the server for the GetMap request with vector and raster layers when the parallel rendering option is activated.
Dataset:
1 Point layer named adress_ban (~ 450 000 features) with the Single symbol renderer and without labels
1 Line layer named hydro_segment (~ 14 000 features) with the Categorized renderer and without labels
1 Line layer named hydro_cours_eau.geoml93 (~ 125 000 features) with the Single Symbol renderer and without labels
1 Polygon layer named vw_clc2006 (~ 3 000 features) with the Categorized renderer and without labels
1 Polygon layer named hydro_lake (~ 800 features) with the Single symbol renderer and without labels
1 Polygon layer named landuse_corine_lc_2006 (~ 3 000 features) with the Categorized renderer and without labels
1 Polygon layer named parcelles (~ 280 000 features) with the Single Symbol renderer and without labels
1 Raster layer named eu_dem_v11 (5324x3374)
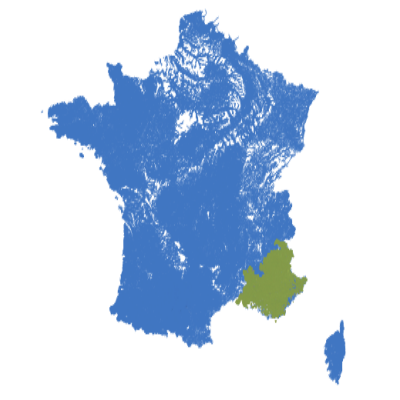
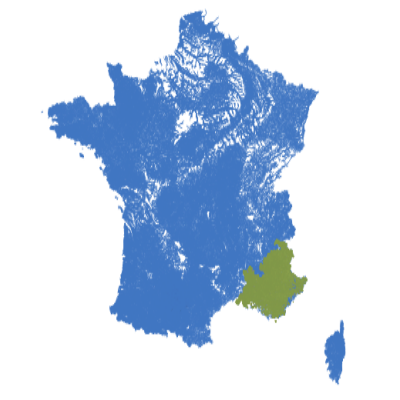
Resulting images:
QGIS Server 2.14
QGIS Server 2.18
QGIS Server 3.0
QGIS Server Master
Results
GetMap: Vector and raster
Description
The aim of this test is to measure the response time of the server for the GetMap request with vector and raster layers. The extent is based on the least extended layer.
Dataset:
1 Point layer named adress_ban (~ 450 000 features) with the Single symbol renderer and without labels
1 Line layer named hydro_segment (~ 14 000 features) with the Categorized renderer and without labels
1 Polygon layer named vw_clc2006 (~ 3 000 features) with the Categorized renderer and without labels
1 Polygon layer named hydro_lake (~ 800 features) with the Single symbol renderer and without labels
1 Polygon layer named landuse_corine_lc_2006 (~ 3 000 features) with the Categorized renderer and without labels
1 Raster layer named eu_dem_v11 (5324x3374)
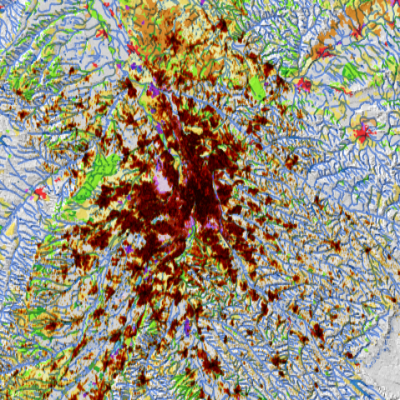
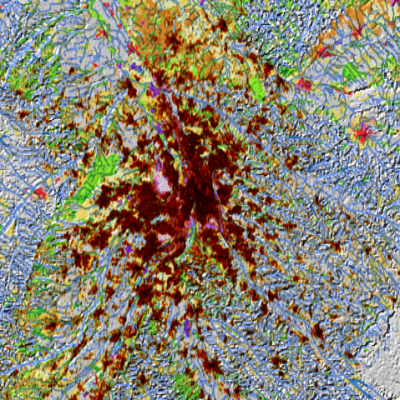
Resulting images:
QGIS Server 2.14
QGIS Server 2.18
QGIS Server 3.0
QGIS Server Master
Results
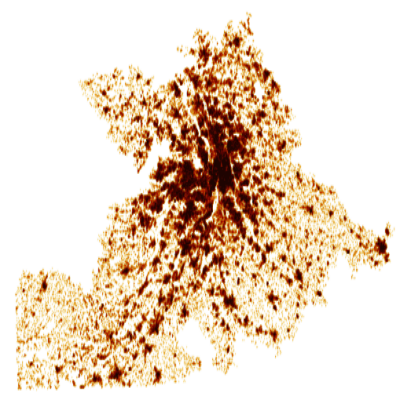
GetMap: Points
Description
The aim of this test is to measure the response time of the server for the GetMap request with vector layers based on points geometries. Moreover, the parallel rendering option is also tested.
Dataset:
1 Point layer named adress_ban (~ 450 000 features) with the Single symbol renderer and without labels
Resulting images:
QGIS Server 2.14
QGIS Server 2.18
QGIS Server 3.0
QGIS Server Master
Results
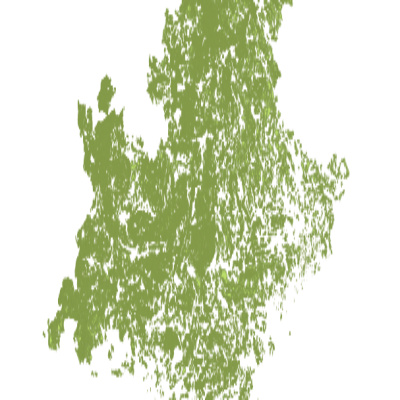
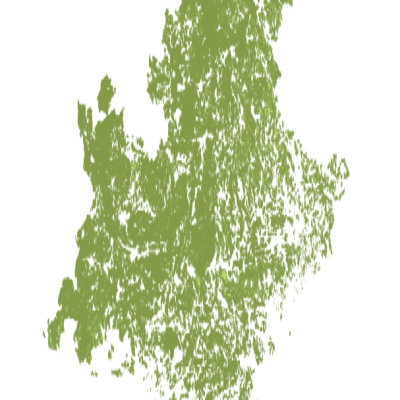
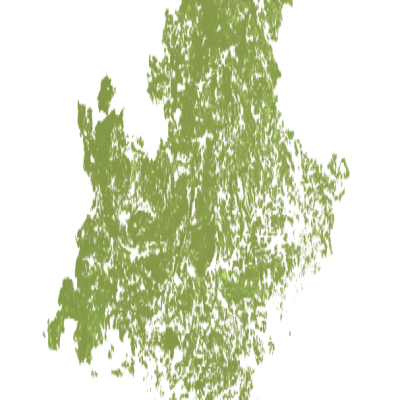
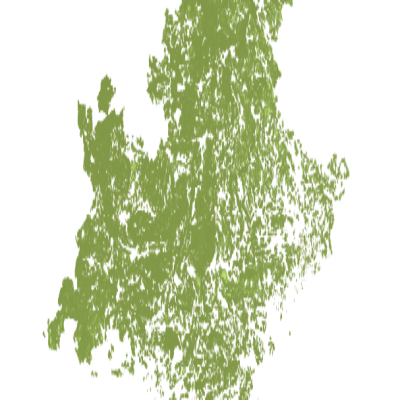
GetMap: Polygons
Description
The aim of this test is to measure the response time of the server for the GetMap request with vector layers based on polygons geometries.
Dataset:
1 Polygon layer named parcelles (~ 280 000 features) with the Single Symbol renderer and without labels
Resulting images:
QGIS Server 2.14
QGIS Server 2.18
QGIS Server 3.0
QGIS Server Master
Results
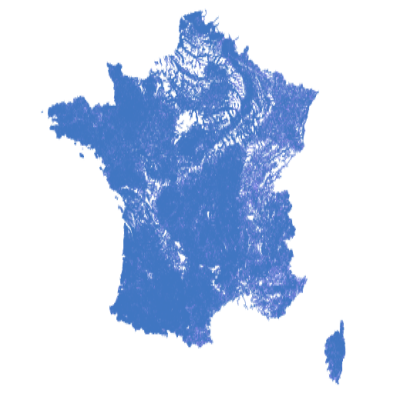
GetMap: Lines
Description
The aim of this test is to measure the response time of the server for the GetMap request with vector layers based on lines geometries. The DPI parameter is 96 (default value).
Dataset:
1 Line layer named hydro_cours_eau.geoml93 (~ 125 000 features) with the Single Symbol renderer and without labels
Resulting images:
QGIS Server 2.14
QGIS Server 2.18
QGIS Server 3.0
QGIS Server Master
Results
GetMap: Lines, parallel labelling and PAL candidates
Description
The aim of this test is to measure the response time of the server for the GetMap request with vector layers based on lines geometries and parallel labelling. Moreover, the influence of PAL candidates is also studied.
Dataset:
1 Line layer named hydro_segment (~ 14 000 features) with the Categorized renderer and parallel labelling
Resulting images are:
QGIS Server 2.14
QGIS Server 2.18
QGIS Server 3.0
QGIS Server Master
Results
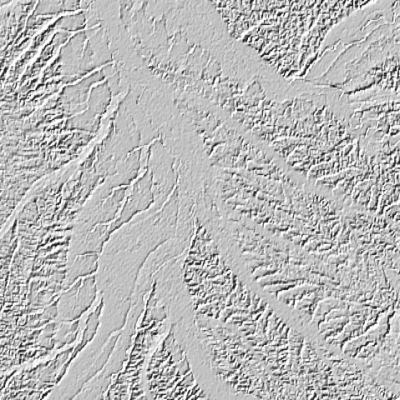
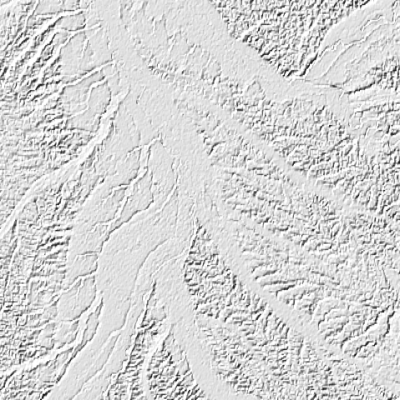
GetMap: Raster
Description
The aim of this test is to measure the response time of the server for the GetMap request with a raster layer.